Success You Can See: Key Marketing Metrics
Written by
12 November 2024
•
6 min read
First 'the why'...
Put simply vibes, hunches and guesswork – don’t work. To better understand the return on your marketing investment and get the edge on your competitors, you need to know how every marketing dollar you spend is being put to work to grow your business. Setting and tracking your key performance indicators (KPIs) using data analytics is essential for getting the most out of your campaigns, understanding customer behaviour, refining your marketing strategy and driving growth. But which metrics matter the most?
Behind every Ad click, website visit, or enquiry form there's no shortage of data - but there is a shortage of time and resources to gather, sort and connect the dots, to show the insights that are truly valuable for your business. So, before you dive in and start eagerly setting those benchmarks, let's break down some of the need-to-know marketing metrics.
Audience Reach
Reach is the overarching term used to describe how many unique people your advertising and marketing efforts have been served to. These metrics give an indication of how much coverage you have across your desired target market:
Reach measures the size of your audience by calculating the number of unique users who see your content (unique users are only counted once, no matter how many times they see or interact with your content).
Impressions measure each time your content appears in front of those unique users, which helps you gauge your share of their attention, but it doesn’t reflect interaction or interest.
What do these metrics look like on ArchiPro?
On ArchiPro, Reach and Impressions are captured across various touchpoints. These include product tags within projects and targeted advertising both on and off the platform. Each avenue helps extend the visibility of your brand, giving insight into how many unique users are discovering your content (Reach) and how often it appears to them (Impressions).
Engagement
These metrics indicate how your advertising and messaging is resonating with your target market. The way they engage with your content can indicate their level of intent / interest.
Sessions refer to the number of visits to your website. A single user can generate multiple sessions, giving you insight into how frequently users are returning or spending time on your website.
Clicks show the number of times users click on your ad, link, Call-to-Action (CTA), or in ArchiPro’s case - clicks on your project pages or products. If someone clicks through, it shows they are connecting with your message, brand, or offer.
Likes, saves, comments and shares are other examples of engagements indicating a level of intent/interest.
Engagement Rate combines these metrics to provide a clearer picture of how engaging your content is in relation to the number of impressions or views. A high engagement rate signals your content and messaging is engaging for people in your target market.
What do these metrics look like on ArchiPro?
Someone may click your ad placement on ArchiPro, they may go on to engage with your content by saving a product or project to a design board. Next they might spend an extended session on your profile, returning for additional visits. If they also click into your projects and explore tagged products, they show a deeper interest in your offerings. Engagements are weighted/scored differently on ArchiPro, which helps represent a user's level of intent, reflected in our analytics reporting.
Click-Through Rate (CTR)
CTR measures the percentage of people who see your ad or link and choose to click on it. This metric is valuable for assessing how relevant or compelling your content is, and it helps you target who you want to see your ads and where they’ll find them.
What does this metric look like on ArchiPro?
CTR is tracked on ArchiPro for actions like users clicking through product tags, seeing your ArchiPro advertisement on Facebook or Instagram and clicking through to visit your profile. I If a user encounters your content organically and then chooses to explore further, this represents a high level of engagement. However, if your CTR is low, it may be a sign to optimise your content to better resonate with your target audience.
Cost Per Click (CPC )
The Cost Per Click is how much your ad costs, divided by the number of clicks it received e.g. You might pay $1 per click and set that to a daily amount. CPC measures how much you're paying each time someone clicks on your ad. What you pay depends on your budget and your deal with your ad platform. A low CPC shows you’re getting more engagement for less money.
What does this metric look like on ArchiPro?
ArchiPro’s advertising analytics tracks the CPC for ads across various channels—whether through social channels, ArchiPro’s digital publication, or on-platform placements.
Conversion Rate
Your conversion rate shows you how well your campaign or offer is resonating by measuring the percentage of visitors who take up your call to action eg. sign-up, learn more, add to cart.
What does this metric look like on ArchiPro?
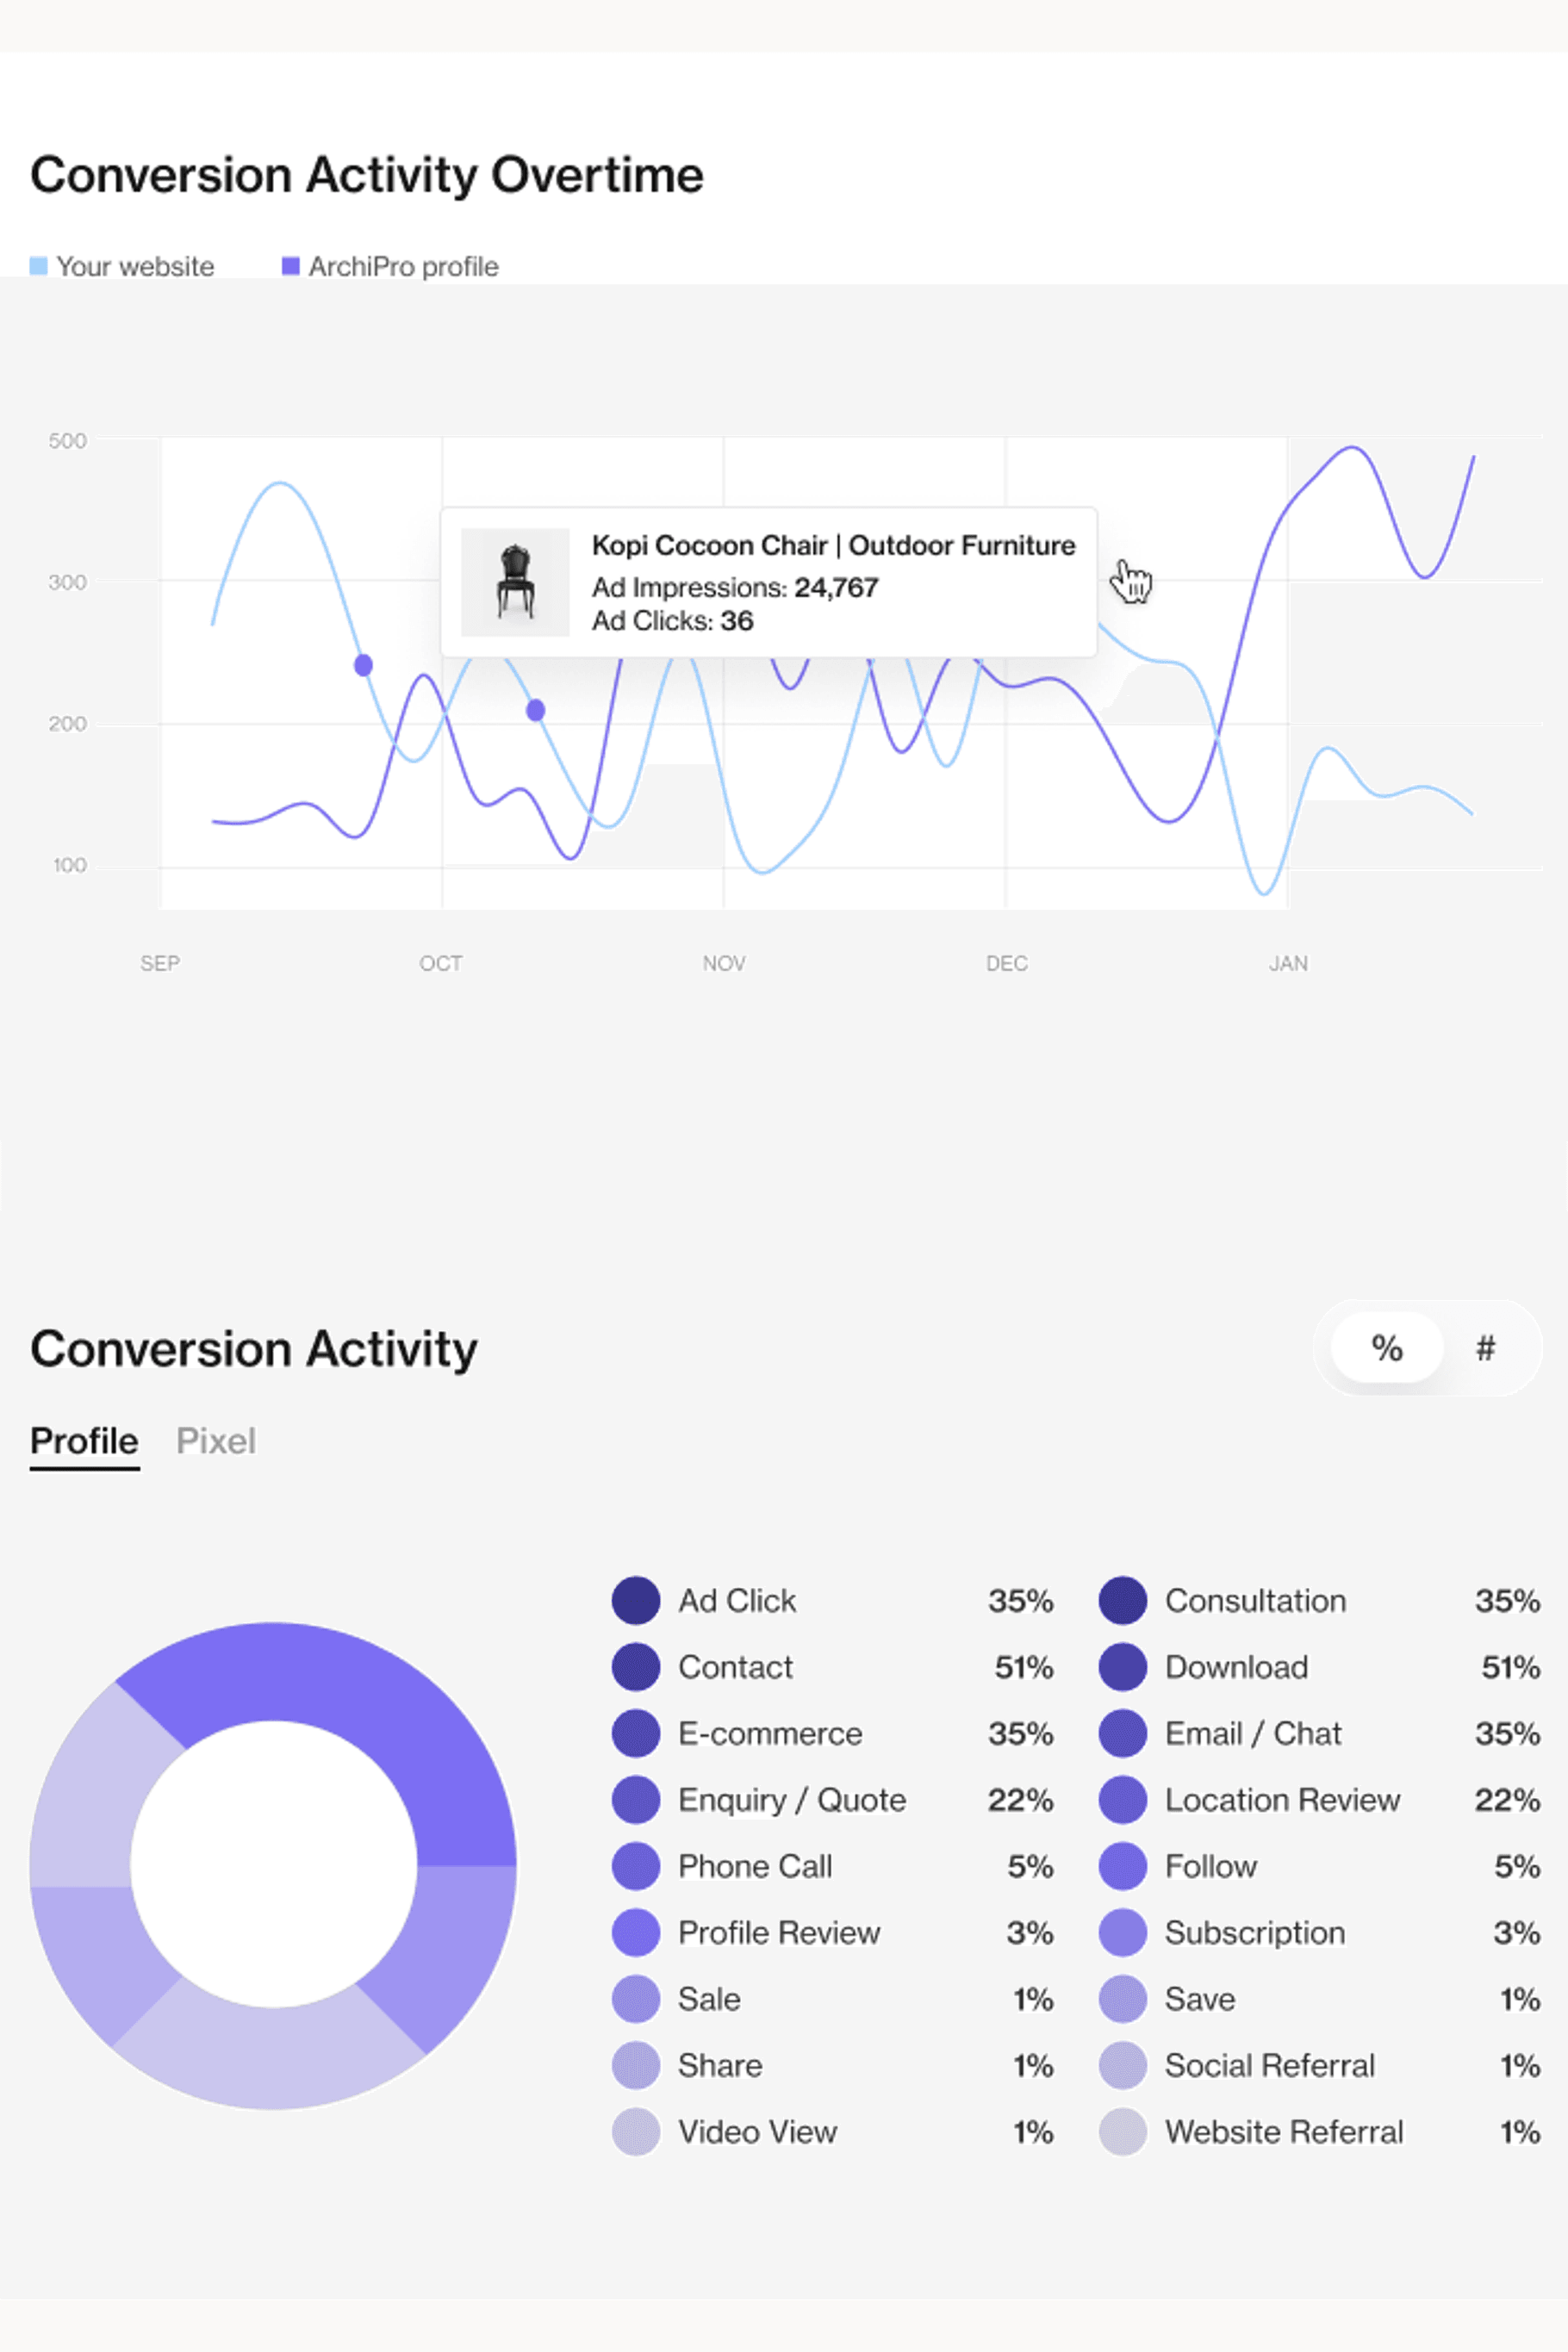
At ArchiPro, we categorise conversions into two types: soft conversions and hard conversions.
Soft conversions include actions like clicking to reveal your business details, downloading a brochure, or navigating from your profile to your website. These indicate interest but may not lead to immediate sales, we label these as ‘prospects’.
Hard conversions, labelled as leads, represent users who take more decisive actions, such as sending a direct inquiry, requesting a consultation, or expressing interest at an ArchiPro event. These conversions typically demonstrate higher intent, suggesting that the lead is more likely to result in a sale, while soft conversions often require further nurturing or additional engagement.
What’s the best way to track these key metrics?
Most of these concepts have simple formulas so you don’t need to be a mathematician to understand your performance. The right analytics tools will do all the heavy lifting for you.
Easy access and visibility of these key metrics is what really matters when it comes to following your customer’s journey and understanding their impression of your brand, product or service. When deadlines loom and your ever-increasing ‘to-do list’ crowds out the bigger picture it's essential to have these key data analytics all in one place.
Why is analytics important?
Leveraging marketing analytics will give you a thorough grasp of a lead's level of intent and their stage in the buying journey. Being able to organise and make sense of these key metrics will help you understand what works and what doesn't. With a data-driven approach, you will be able to allocate your marketing budget and efforts more strategically and focus on what really matters when it comes to growing your business.